What is Open Interest? Complete Trading Guide

What is Open Interest? A Simple Guide for Everyone | Trendy Traders
Introduction
If you’ve ever looked at the stock market or derivatives trading and felt confused by terms like open interest, you’re not alone. Many beginners stare at charts filled with numbers and wonder—what does it all actually mean?
Here’s the good news: open interest is not as complicated as it sounds. In fact, once you understand it, it becomes one of the most useful tools in trading.
Think of the market like a crowded marketplace. Every buyer and seller is making deals, but not every deal closes and disappears instantly. Some trades remain “open,” and that’s where open interest comes in.
In this article, we’ll break down everything about what is open interest, how it works, and how traders use it with tools like open interest chart, nifty open interest, and participant wise open interest NSE. We’ll also explore how concepts like increase in open interest and increase in price can help you understand market direction better.
What is Open Interest?
Let’s start with the basics.
Open interest (OI) refers to the total number of active contracts in the derivatives market that have not been settled or closed.
In simple words:
-
If a buyer opens a new contract → OI increases
-
If a seller closes a contract → OI decreases
It applies mainly to futures and options markets.
So, when people ask “what is open interest”, the simplest answer is:
It is the number of active, open positions in the market at any point in time.
Unlike stock prices that show value, open interest shows activity and commitment in the market.
How Open Interest Works in Markets
To understand it better, imagine a game of chess.
Every time two players start a game, one opens a new match. That match stays “active” until it ends. Similarly, in trading, every contract remains open until both parties close it.
Here’s how it changes:
-
New buyer + new seller → Open interest increases
-
Old buyer + new seller → No change
-
Both close positions → Open interest decreases
This flow helps traders understand whether money is entering or leaving the market.
Difference between Open Interest and Volume
Many beginners confuse these two.
Let’s clear it:
Volume
Volume shows how many contracts were traded in a day.
Open Interest
Open interest shows how many contracts are still active.
Think of it like this:
-
Volume = number of tickets sold today
-
Open interest = tickets still valid for future events
Both are important, but they tell different stories.
Why Open Interest Matters in Trading
So why do traders care about it?
Because open interest helps answer key questions like:
-
Is money entering the market?
-
Are traders building positions or exiting?
-
Is the trend strong or weak?
When combined with price movement, open interest becomes a powerful tool.
For example:
-
Rising OI + rising price = strong bullish trend
-
Rising OI + falling price = strong bearish trend
This is where concepts like increase in open interest and increase in price become very important.
Open Interest Chart Explained
An open interest chart visually shows how OI changes over time.
It usually includes:
-
Price line
-
Open interest line
-
Volume bars
Why it matters:
-
Helps identify market strength
-
Shows accumulation or distribution
-
Supports trend confirmation
If price is rising but OI is not increasing, the trend may be weak. On the other hand, rising OI with rising price signals strong buying interest.
Nifty Open Interest Basics
When traders talk about nifty open interest, they are referring to the open interest in Nifty index futures and options.
Why Nifty OI is important:
-
It reflects overall market sentiment
-
Used by institutional traders
-
Helps predict support and resistance zones
For example:
-
High call OI at a strike price = resistance
-
High put OI at a strike price = support
This makes Nifty OI a key tool for intraday and swing traders.
Increase in Open Interest and Increase in Price
This is one of the most powerful combinations in trading.
Scenario 1: Increase in OI + Increase in Price
-
Strong buying interest
-
Bullish trend confirmed
Scenario 2: Increase in OI + Decrease in Price
-
Strong selling pressure
-
Bearish trend confirmed
Scenario 3: Decrease in OI
-
Traders are closing positions
-
Weak or uncertain trend
So when you see increase in open interest and increase in price, it often signals that buyers are confident and building positions.
Participant Wise Open Interest NSE
Now let’s talk about something more advanced: participant wise open interest NSE.
The market has different types of participants:
-
Retail traders
-
Foreign Institutional Investors (FII)
-
Domestic Institutional Investors (DII)
-
Proprietary traders
Participant-wise data shows:
-
Who is buying?
-
Who is selling?
-
Who is holding positions?
This helps in understanding “smart money” behavior. For example, if FIIs are increasing long positions, it may indicate bullish sentiment.
This breakdown gives a deeper view than just price charts.
How Traders Use Open Interest in Decisions
Traders combine open interest with other tools like price action and volume.
Here’s how they use it:
-
To confirm trend direction
-
To identify reversals
-
To spot breakout strength
-
To analyze options data
For example:
If Nifty breaks resistance with rising OI, traders may consider it a strong breakout.
Many professionals also use open interest chart tools to time entry and exit points more accurately.
Common Mistakes Traders Make
Even though open interest is powerful, beginners often misuse it.
Some common mistakes:
-
Using OI without price context
-
Confusing volume with open interest
-
Ignoring participant-wise data
-
Overtrading based on single signals
Remember: OI is not a standalone indicator. It works best when combined with other tools.
Real-Life Analogy of Open Interest
Let’s simplify it even more.
Imagine a movie theater:
-
Tickets sold today = volume
-
Seats occupied in ongoing show = open interest
If more people keep entering the theater and seats are filling up, the show is gaining popularity.
Similarly, if open interest is rising with price, it means more traders are “entering the show” and believing in the trend.
This simple analogy helps beginners understand the concept quickly.
Tools and Online Stock Trading Courses
If you want to learn how to read open interest chart, nifty open interest, and participant wise open interest NSE, you need proper guidance.
That’s where online stock trading courses come in.
These courses help you:
-
Understand derivatives trading
-
Read market data effectively
-
Analyze open interest and volume
-
Build trading strategies
Many beginners start with free resources but eventually move to structured learning for better results.
Learning trading is like learning a sport—you need practice, strategy, and guidance.
Conclusion
Open interest may sound technical at first, but once you break it down, it becomes a simple and powerful concept. It tells you how many contracts are active and helps you understand market strength.
Whether you are analyzing nifty open interest, studying participant wise open interest NSE, or checking an open interest chart, the goal is the same—to understand where the market is heading.
When combined with price movement, especially increase in open interest and increase in price, it becomes a strong signal for traders.
In the end, mastering open interest can help you see the market not just as numbers, but as the behavior of real people making real decisions.
FAQs
1. What is open interest in simple words?
Open interest is the total number of active futures or options contracts that have not been closed or settled.
2. How is open interest different from volume?
Volume shows how many contracts were traded, while open interest shows how many contracts are still active.
3. What does increase in open interest and increase in price mean?
It usually indicates strong buying interest and a bullish market trend.
4. What is participant wise open interest NSE?
It shows open interest data broken down by market participants like retail traders, FIIs, DIIs, and proprietary traders.
5. Can beginners learn open interest easily?
Yes, with practice and online stock trading courses, beginners can easily understand and apply open interest in trading decisions.
الأقسام
إقرأ المزيد
Style matters, yet spending less remains possible down under. Though many chase the Essentials hoodie, its cost often climbs too high. A different route exists - practical choices bring similar looks, built for daily ease. Each option carries quiet confidence, fitting seamlessly into everyday wear. These picks move beyond trend noise, focusing on what lasts. Availability shifts often,...

Keeping your home or office clean is important for a healthy and comfortable life. But in a busy city like Ahmedabad, regular deep cleaning becomes difficult because of work and daily routine. That’s why many people now prefer professional housekeeping services. If you are searching for the best Housekeeping Services in Ahmedabad, this guide will help you understand everything in a simple...
Healthy eyes are important for daily life, comfort, productivity, and overall wellness. People use their eyes constantly for reading, driving, working, learning, and enjoying everyday activities. Modern lifestyles often include long screen time, stress, poor sleep, unhealthy eating habits, and environmental pollution. These factors may affect vision comfort and overall wellness over time. Many...
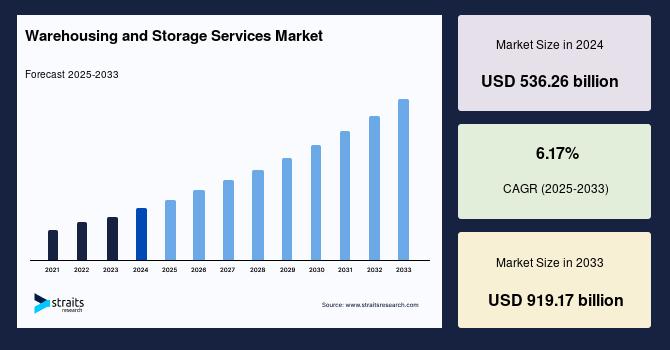
Warehousing and Storage Services Industry Outlook: Straits Research has introduced a detailed analytical study on the Warehousing and Storage Services Market, offering insights into market valuation, segmentation framework, and long-term growth trajectory. The publication delivers a structured overview of market drivers, constraints, technological advancements, and strategic developments...
Singapore Changi Airport, widely known by the airport code SIN Airport, is one of the most recognized travel hubs in the world. Located in Singapore, it serves millions of passengers each year and connects travelers to destinations across Asia, Europe, the Middle East, Australia, and beyond. More than just a transit point, it is often praised for making airport travel comfortable, efficient,...