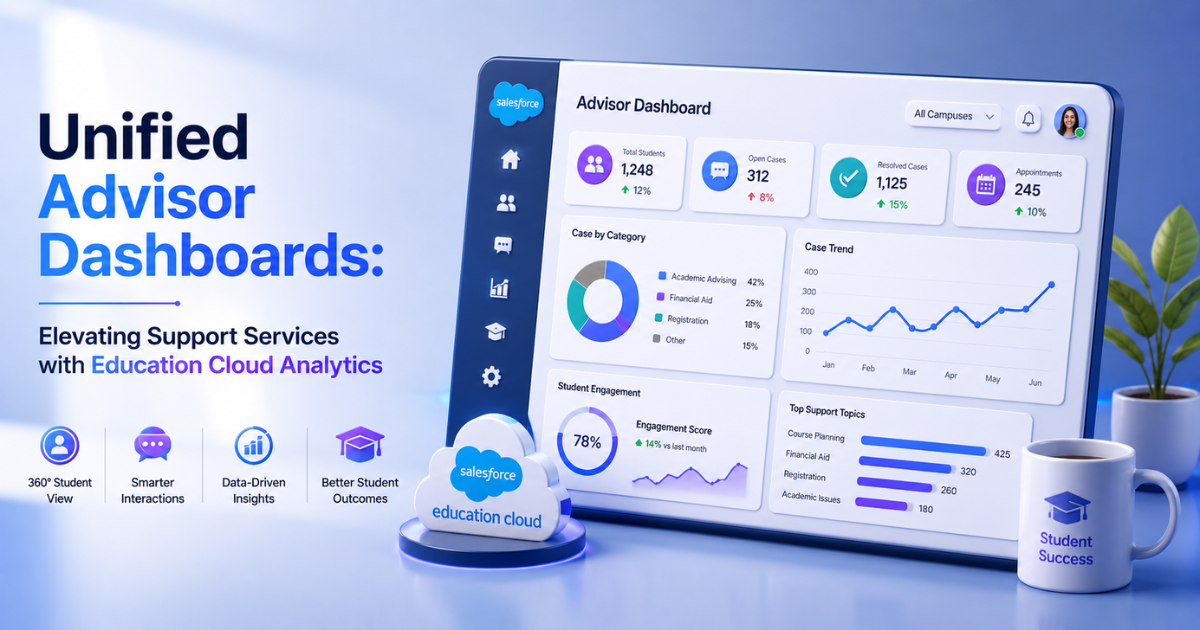
Unified Advisor Dashboards: Elevating Support Services with Education Cloud Analytics
The modern higher education sector faces a major retention crisis. Students navigate complex academic environments, financial stresses, and administrative roadblocks daily. When a student struggles, the warning signs appear across multiple separate systems. The learning management system (LMS) logs a drop in assignment submissions. The campus housing portal registers lower dining hall attendance. Concurrently, the student information system (SIS) records a dip in midterm grades.
Unfortunately, traditional university infrastructures trap these data points in separate department databases. Academic advisors cannot see these flashing red flags because they lack a single, unified view. Advisors often find out a student is failing only after that student withdraws from the university. This delayed reaction severely damages graduation metrics and institutional tuition revenues.
Choosing professional Salesforce Education Cloud Consulting allows institutions to break down departmental data silos. This approach unifies student information into live advisor dashboards. These specialized analytics tools turn scattered data into proactive early interventions.
Architectural Barriers to Student Success
To understand why advisors struggle to support students, look at a typical university data network. Most campuses run a fragmented mix of legacy applications.
The Fragmented Campus Environment
-
The SIS Layer: Holds demographic data, financial aid packages, and final semester grades.
-
The LMS Layer: Captures high-frequency engagement metrics, including weekly quiz scores and portal login times.
-
The Student Life Layer: Tracks card swipes at recreational centers, library book checkouts, and housing check-ins.
Because these applications operate independently, advisors must log into multiple separate platforms to review one student's status. This manual tracking process wastes valuable time. Advisors spend hours compiling spreadsheets instead of actively counseling students.
Furthermore, manual reporting delays critical support actions by weeks. Salesforce Education Cloud Consulting Services resolve this structural fragmentation. The platform ingests data from these separate applications, creating a single, comprehensive view of the student lifecycle.
Technical Architecture of a Unified Dashboard
Building a responsive advisor dashboard requires a modern, multi-layered data pipeline. The system must process high-frequency behavioral data alongside transactional academic records without slowing down the core platform.
1. The Data Ingestion Layer
First, developers deploy integration tools like MuleSoft or Apache Kafka to extract data from external databases. The system streams batch records from the SIS nightly. Concurrently, it captures real-time clickstream events from the LMS platform.
2. The Storage and Harmonization Layer
The incoming data flows into Salesforce Data Cloud. This ingestion engine matches duplicate identities using precise reconciliation rules, such as combining institutional email strings and national identity numbers.
The system maps the cleaned data directly to the native Education Cloud data model. This framework organizes data into standardized objects, including AcademicTermEnrollment, CourseOffering, and LearnerProgramRequirement.
3. The Analytics Visualization Layer
CRM Analytics for Education processes these unified data tables. The platform runs optimized data sync operations to update advisor dashboard visualizations every hour. This fast processing loop ensures staff view fresh operational data during student appointments.
Core Predictive Metrics for Early Intervention
An actionable advisor dashboard must display more than basic historical grade point averages (GPAs). Effective visual interfaces focus on predictive behavioral indicators. These specific data points identify at-risk students weeks before final exams begin.
1. Learning Management System Engagement Trends
This component tracks how often and how long a student interacts with course materials online. The system establishes a baseline by analyzing historical engagement patterns within each academic major.
If a student's weekly login frequency drops more than 35% below the course average, the dashboard flags the change. This drop often serves as the earliest indicator of academic disengagement.
2. Academic Progress Indicators
This metric combines low-stakes assessment scores, such as early quizzes and homework assignments. The analytics engine runs a localized trend formula:
$$\text{Performance Trajectory} = \frac{\Delta \text{ Assessment Scores}}{\Delta \text{ Time}}$$
A negative performance trajectory warns the advisor that a student's understanding of the material is actively declining, even if their overall GPA remains above passing levels.
3. Milestone Achievement Tracker
This metric tracks how effectively a student completes core program requirements for graduation. The dashboard compares the student's completed units against their structured degree blueprint. It highlights missing prerequisites or low course completion rates that could delay graduation.
4. Pulse Check Feedback
Universities issue short, automated digital surveys called pulse checks during the third and sixth weeks of the term. The dashboard imports this direct student sentiment data. It flags students who report high levels of stress, housing issues, or financial confusion.
Designing an Actionable Advisor Interface
An effective layout helps advisors identify students who need help immediately. Technical teams follow a structured setup inside the Analytics Studio to keep interfaces clean and functional.
Step 1: Establish Dataset Security
Open the Data Manager within your cloud platform. Student data requires strict compliance with privacy laws like the Family Educational Rights and Privacy Act (FERPA). Configure row-level security policies to ensure users view only authorized data:
JSON
"$User.Advisor_Role_Code__c == AcademicTermEnrollment.Advisor_ID__c"
This security predicate restricts access automatically. Advisors view data only for students assigned to their specific cohort.
Step 2: Implement Visual Alert Systems
Place high-level summary counters along the top edge of the dashboard screen. Use conditional highlighting rules to draw attention to urgent cases.
For example, set high-risk indicators to display in bold text with bright backgrounds. This format helps advisors spot critical status changes within a cohort of hundreds of students.
Step 3: Embed Actionable Task Workflows
Incorporate native CRM custom actions directly into your visualization charts. This design allows advisors to initiate support plans without leaving the dashboard interface.
With one click on a student's chart icon, an advisor can create a follow-up task, send an email template, or open a referral ticket with the campus tutoring center.
Real-World Case Study: Public Research University
A major public research university with 22,000 enrolled students faced declining first-year retention numbers. The institution managed student support using separate legacy databases across different departments.
Advising teams operated reactively, reaching out to students only after professors filed official failing grades at the end of the term. This structural delay caused first-year dropouts to climb to an unsustainable rate of 24%.
The university partnered with professional Salesforce Education Cloud Consulting experts to overhaul its student support infrastructure. The consulting engineers connected the campus Canvas LMS and an on-premises Oracle SIS database directly to Salesforce Data Cloud. They built a unified advisor console powered by CRM Analytics.
Verified Deployment Results
-
According to verified studies by Forrester Research, implementing Salesforce Education Cloud solutions increases first-year student retention rates by an average of 15%.
-
The university cut manual data aggregation time for advisors by 43%, saving hours of administrative work each week.
-
Independent research shows that data-driven early intervention models achieve up to 88% accuracy in identifying at-risk students during the first 12 weeks of the semester.
Four weeks into the autumn semester, the dashboard flagged 14 students within a single advisor's cohort. These students showed a 40% drop in LMS engagement alongside low quiz scores in introductory chemistry.
The automated system created an early intervention alert container on the advisor's home console. The advisor reviewed the combined behavioral view and noticed the shared problem. They set up group tutoring sessions and sent targeted text messages to the affected students that same afternoon.
Best Practices for Dashboard Maintenance
Maintaining an analytics platform requires ongoing technical updates. Teams must manage system data regularly to ensure long-term usability and accurate reporting.
-
Audit Sync Recipes Weekly: Monitor your data sync completion logs inside the Data Manager. Fix failing connection scripts during low-traffic weekend hours to maintain accurate data streams.
-
Review Rule Logic Rules Termly: Meet with academic deans before every semester to update your risk formulas. Adjust performance weighting parameters to match changing course structures and grading rubrics.
-
Purge Legacy Log Files: Delete historical clickstream rows older than two years from your active analytics engines. Archiving old data keeps dashboards running fast and lowers cloud storage fees.
-
Run Continuous Training Audits: Partner with your Salesforce Education Cloud Consulting Services provider to host quarterly advisor training sessions. Gather direct user feedback to remove unused dashboard elements and add helpful features.
Conclusion
Leaving campus data trapped in separate department silos limits the effectiveness of student support teams. Reactive advising practices cannot scale to meet the needs of modern higher education.
Building unified advisor dashboards within the education platform changes how universities protect student retention. This integrated approach connects behavioral datasets with core academic profiles, allowing advisors to launch targeted interventions before students fall too far behind.
Partnering with certified implementation experts provides the technical design patterns, data pipelines, and security configurations needed to build a responsive, data-driven campus that secures long-term student success.
Categorias
Leia Mais
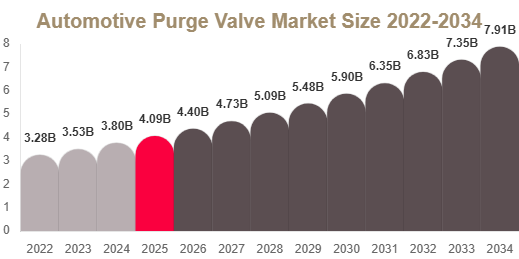
Automotive Purge Valve Market Overview The Automotive Purge Valve Market is witnessing steady growth driven by increasing global focus on emission control systems, stricter environmental regulations, and rising production of gasoline-powered and hybrid vehicles. Automotive purge valves play a critical role in EVAP systems by controlling fuel vapor flow from the charcoal canister to the engine...
Sunwin Hỗ Trợ 24/7: Dịch Vụ Khách Hàng Tận Tâm Đáng Tin CậyKhi tham gia vào các hoạt động giải trí trực tuyến như cá cược, việc đảm bảo rằng người chơi luôn nhận được sự hỗ trợ kịp thời và hiệu quả là điều vô cùng quan trọng. Sunwin, một trong những nhà cái hàng đầu, đã khẳng định...
I spend a lot of evenings with friends watching shows, playing games or just talking late into the night. Those moments feel better when there is something easy to share that adds a little enjoyment without changing the mood. The Raz Nightcrawler Flavor caught my attention because the strawberry ice taste gives a cool, sweet hit that stands out in group settings. It has become my choice when we...

Die gmp zertifikat kosten sind ein entscheidender Faktor für Unternehmen in regulierten Branchen wie Pharma, Lebensmittel und Kosmetik. Eine GMP-Zertifizierung (Good Manufacturing Practice) stellt sicher, dass Produkte konsistent nach hohen Qualitätsstandards hergestellt werden. Doch wie setzen sich die Kosten zusammen, und welche Faktoren beeinflussen sie? Dieser Artikel...
PRP hair treatment in Abu Dhabi has become one of the most trusted non-surgical solutions for individuals experiencing hair thinning, hair fall, and reduced hair density. This advanced treatment uses the body’s natural healing components to stimulate hair follicles and encourage regrowth. In a city like Abu Dhabi, where people are exposed to environmental stress, heat, and...