From Pixels to Insights: A Breakdown of Geospatial Imagery Analytics Solutions
The ecosystem of modern Geospatial Imagery Analytics Solutions is comprised of a multi-stage workflow, often delivered as an integrated platform, that transforms raw satellite or aerial imagery into actionable business and operational intelligence. These solutions are designed to handle the entire end-to-end process, from data acquisition and preparation to the final delivery of insights through dashboards, reports, or API integrations. The core purpose of these platforms is to automate and scale the complex task of image analysis, enabling organizations to monitor assets, understand environmental changes, and track economic activity anywhere on the globe. The solutions are typically offered as cloud-based, Software-as-a-Service (SaaS) subscriptions, allowing users to access powerful computational resources and sophisticated algorithms without needing to manage the underlying complex infrastructure themselves.
The first stage of any solution is data ingestion and preparation. This involves accessing imagery from a variety of sources, whether it's a direct satellite downlink, an archive from a commercial data provider, or uploads from a drone. This raw imagery is often not immediately usable for analysis. The solution must perform a series of critical pre-processing steps. This includes radiometric correction to adjust for atmospheric haze, and orthorectification, which is the process of geometrically correcting the image to remove distortions caused by sensor tilt and terrain, making it map-accurate. This pre-processing is a computationally intensive but essential step that ensures all imagery is clean, consistent, and ready for the analytics engine, providing a reliable foundation for all subsequent analysis.
The heart of the solution is the analytics engine, which is powered by a library of specialized geospatial and computer vision algorithms. These algorithms are the tools that extract information from the pixels. They can be broadly categorized into several types. Detection and counting algorithms are used to identify and tally specific objects of interest, such as vehicles, buildings, airplanes, or even solar panels. Change detection solutions compare images of the same location taken at different times to automatically highlight areas of significant change. Classification algorithms are used to segment an image into different categories, such as creating a detailed land use map that distinguishes between forest, water, urban, and agricultural areas. Many modern solutions allow users to train their own custom AI models to detect specific objects unique to their business needs.
The final, and arguably most important, component of a geospatial imagery analytics solution is the visualization and dissemination layer. The results of the analysis are of little value if they cannot be easily understood and acted upon by decision-makers. To this end, solutions provide a range of output formats. Interactive web-based dashboards and mapping interfaces allow users to explore the data, click on detected objects to get more information, and view change over time with a simple slider. Automated reporting tools can generate summary statistics and PDF reports for management. For more advanced users, the insights are often delivered via an Application Programming Interface (API), which allows the data (e.g., the number of cars counted at a location each day) to be fed directly into other business intelligence platforms, financial models, or operational systems, seamlessly integrating the geospatial intelligence into the organization's daily workflows.
Explore More Like This in Our Regional Reports:
APAC IT Service Management Market
Categorías
Read More
Websites do not stay the same for very long anymore, even if they looked solid a few months earlier during your first check. Some blogs publish regularly for a while, then suddenly slow down without any clear reason behind it. That shift matters more than people expect. Good Curated link building usually involves checking sites manually instead of trusting old metrics sitting inside SEO tools....

Candles have been a part of everyday life for centuries, bringing warmth, beauty, and comfort into homes around the world. Today, candles are more than just a source of light—they are used for relaxation, decoration, celebrations, and meaningful gifting. Whether you enjoy calming scented candles or beautifully crafted handmade candles, there is a perfect candle for every mood and...

Introduction Healthcare organizations across the world are rapidly adopting connected technologies to improve patient outcomes, operational efficiency, and real-time medical insights. Hospitals, clinics, and healthcare providers now rely on smart devices and connected systems to monitor patients continuously and deliver personalized care. The Internet of Medical Things (IoMT) Platform is...

The global chef apparel market is expected to experience steady expansion over the next decade as the foodservice industry continues to grow worldwide. The market is projected to increase from approximately USD 3.9 billion in 2026 to around USD 6.3 billion by 2036, registering a CAGR of about 4.9%, according to the latest analysis by Future Market Insights (FMI)....
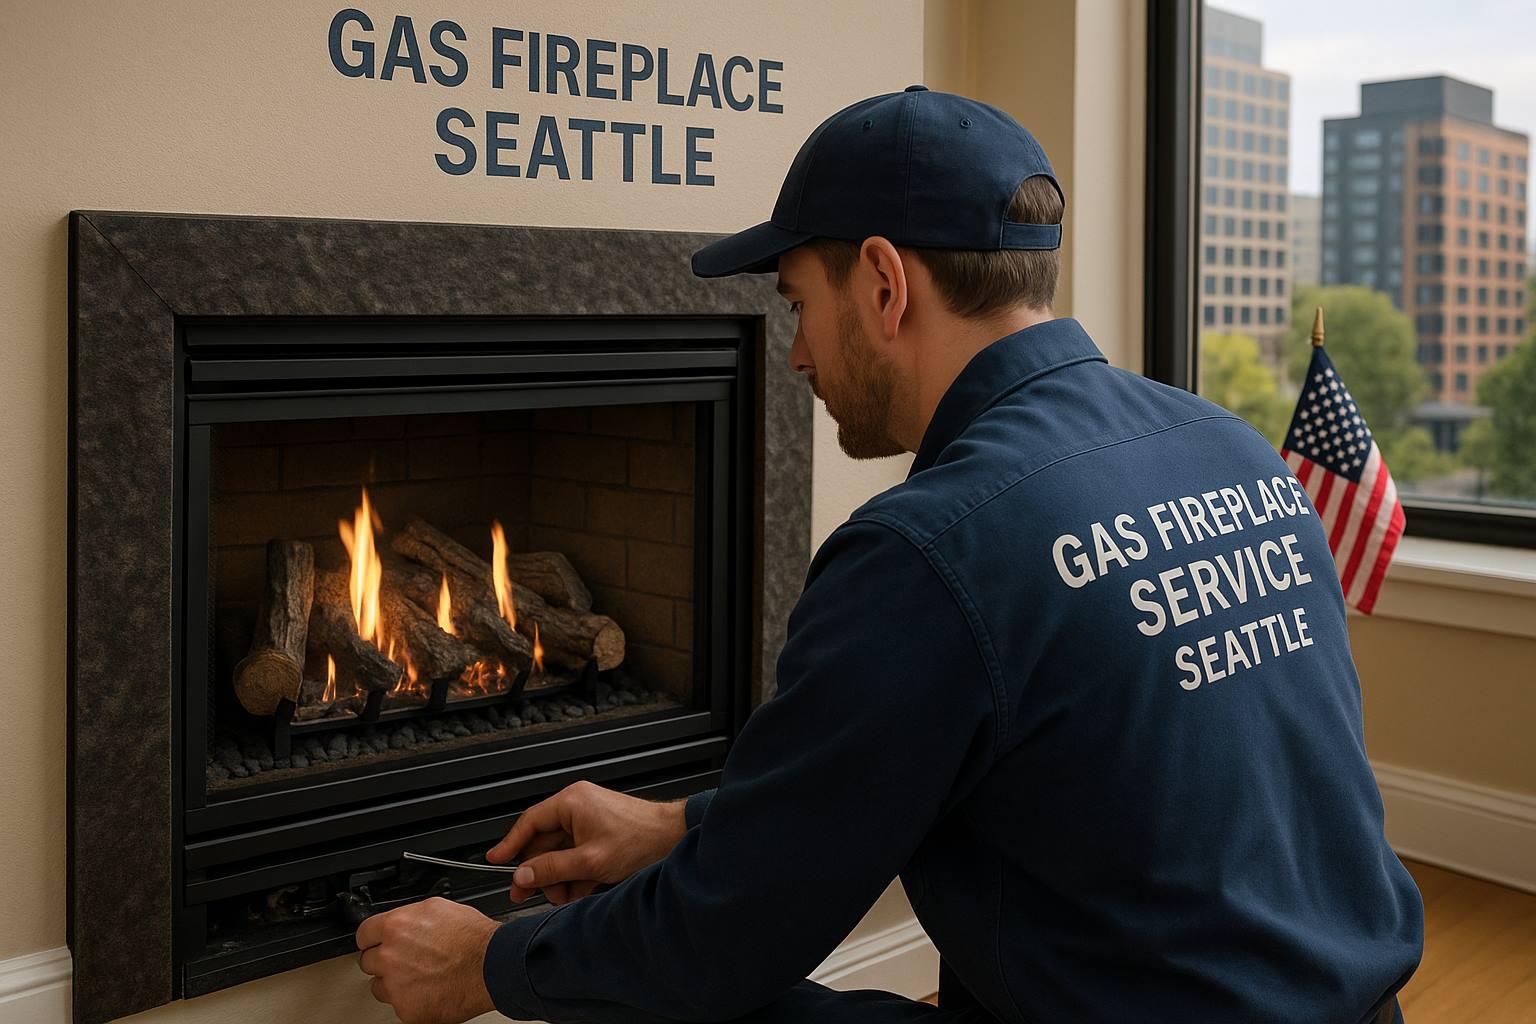
When you want to keep your hearth running safely and efficiently, understanding the licensing requirements for gas fireplace servicing is crucial. In Seattle, professionals handling gas appliance repairs or installations must meet specific standards to ensure safety and compliance. This article breaks down what you need to know about licensing and the practical aspects of service so you can...