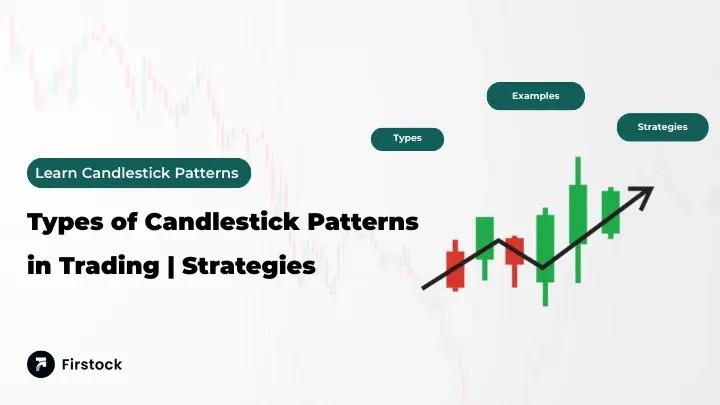
All Types of Candlestick Patterns Explained | Firstock

All Types of Candlestick Patterns – Firstock
Introduction
Have you ever looked at a stock chart and wondered what those little red and green bars mean? Those aren’t just random shapes—they’re candlestick patterns, one of the most powerful tools traders use to understand price movements. If charts feel overwhelming, don’t worry. By the end of this guide, you’ll have a clear picture of what candlestick patterns are, why they matter, and how to use them.
Think of candlestick patterns like the language of the stock market. Just like facial expressions reveal emotions, candlestick patterns reveal the market’s mood—whether it’s feeling bullish, bearish, or uncertain.
In this article, we’ll walk through all types of candlestick patterns, break them down in simple terms, and show you how they can help you make smarter trading decisions.
Learn what is candlestick pattern and explore all types of candlestick patterns in trading. Understand types of candlestick patterns to make better market decisions.
What is Candlestick Pattern?
A candlestick pattern is a way of representing price movement in financial markets like stocks, forex, and crypto. Each candlestick shows four key pieces of information for a specific time period:
-
Open Price (where the market started)
-
Close Price (where it ended)
-
High Price (the peak during that time)
-
Low Price (the lowest point reached)
Imagine each candlestick as a mini story of battle between buyers (bulls) and sellers (bears).
Why Are Candlestick Patterns Important in Trading?
Candlestick patterns are important because they:
-
Show market psychology – who is in control, buyers or sellers.
-
Help predict future price moves – though not 100% accurate, they give strong signals.
-
Work across all markets – stocks, forex, commodities, crypto.
-
Simplify decision-making – instead of dozens of technical indicators, traders can read candlesticks for quick analysis.
In short, candlesticks are like traffic lights on the trading highway—they signal when to stop, go, or proceed with caution.
Structure of a Candlestick Explained
A candlestick has three parts:
-
Body – shows the difference between the opening and closing prices.
-
Green/white = bullish (close is higher than open).
-
Red/black = bearish (close is lower than open).
Wick/Shadow – lines above and below the body showing highs and lows.
Open and Close – these points reveal whether bulls or bears had control.
This simple structure forms the base for all types of candlestick patterns.
Types of Candlestick Patterns
There are three major categories of candlestick patterns:
-
Single Candlestick Patterns – formed by one candle.
-
Double Candlestick Patterns – formed by two candles.
-
Triple Candlestick Patterns – formed by three candles.
Let’s go deeper into each type.
Single Candlestick Patterns
These patterns are formed by a single candlestick and are often early indicators of reversals or continuations.
Doji Candlestick Pattern
A Doji forms when the open and close prices are nearly the same. It looks like a plus sign (+).
-
Meaning: Market indecision. Buyers and sellers are equally strong.
-
Types of Doji:
-
Standard Doji
-
Long-Legged Doji
-
Dragonfly Doji
-
Gravestone Doji
-
Think of a Doji as a “pause button” in the market.
Hammer and Inverted Hammer
-
Hammer: Small body, long lower wick. Appears after a downtrend.
-
Signal: Buyers are coming in, possible bullish reversal.
-
-
Inverted Hammer: Small body, long upper wick.
-
Signal: Early sign of bullish reversal but weaker than Hammer.
-
Hanging Man and Shooting Star
-
Hanging Man: Looks like a hammer but forms at the top of an uptrend.
-
Signal: Possible bearish reversal.
-
-
Shooting Star: Small body, long upper wick, appears after an uptrend.
-
Signal: Strong selling pressure.
-
Spinning Top and Marubozu
-
Spinning Top: Small body with long wicks on both ends.
-
Signal: Market uncertainty.
-
-
Marubozu: Candle with no wick, just a strong body.
-
Bullish Marubozu: Buyers dominated.
-
Bearish Marubozu: Sellers dominated.
-
Double Candlestick Patterns
These involve two candles and often show stronger reversal signals.
Bullish Engulfing & Bearish Engulfing
-
Bullish Engulfing: A small red candle followed by a big green candle covering it fully.
-
Signal: Strong bullish reversal.
-
-
Bearish Engulfing: A small green candle followed by a big red candle.
-
Signal: Bearish reversal.
-
Piercing Pattern & Dark Cloud Cover
-
Piercing Pattern: Bullish signal when a green candle closes above the midpoint of the previous red candle.
-
Dark Cloud Cover: Bearish signal when a red candle closes below midpoint of the previous green candle.
Tweezer Tops and Tweezer Bottoms
-
Tweezer Top: Two candles with similar highs, seen in uptrends.
-
Tweezer Bottom: Two candles with similar lows, seen in downtrends.
Triple Candlestick Patterns
These patterns involve three candles and provide even stronger signals.
Morning Star and Evening Star
-
Morning Star: Bullish reversal. Formed by a red candle, a small-bodied candle, and a big green candle.
-
Evening Star: Bearish reversal. Formed by a green candle, a small-bodied candle, and a big red candle.
Three White Soldiers & Three Black Crows
-
Three White Soldiers: Three strong green candles in a row.
-
Signal: Strong bullish trend.
-
-
Three Black Crows: Three red candles in a row.
-
Signal: Strong bearish trend.
-
Three Inside Up & Three Inside Down
-
Three Inside Up: A bullish reversal pattern within three candles.
-
Three Inside Down: A bearish reversal pattern within three candles.
How to Use Candlestick Patterns in Real Trading
-
Combine with indicators (like RSI, MACD).
-
Check multiple timeframes before making decisions.
-
Look for confirmation instead of trading on the first signal.
-
Practice on demo accounts before going live.
Common Mistakes Beginners Make
-
Relying only on candlesticks without confirmation.
-
Ignoring the bigger trend.
-
Overtrading every pattern spotted.
-
Not using risk management.
Conclusion
Candlestick patterns are like the heartbeat of the stock market. They reveal whether the bulls or bears are in charge and help traders anticipate what might come next. By understanding all types of candlestick patterns, you gain a powerful tool that can guide your trading journey.
The next time you look at a chart, don’t just see colors and shapes—see the story the market is telling you.
FAQs
1. What is candlestick pattern in simple words?
A candlestick pattern is a chart representation of price movement that helps traders understand market behavior.
2. How many types of candlestick patterns are there?
There are three main types: single, double, and triple candlestick patterns, with many variations under each.
3. Are candlestick patterns accurate?
They aren’t 100% accurate but provide reliable signals when combined with other indicators.
4. Can beginners use candlestick patterns?
Yes! Beginners can start with basic patterns like Hammer, Doji, and Engulfing.
5. Do candlestick patterns work in crypto and forex?
Absolutely. Candlestick patterns work across stocks, forex, commodities, and cryptocurrencies.


