How I Pick Winning Stocks Using Fundamental Analysis

I lost ₹42,000 on a stock.
Everyone said it was “going to moon.”
I bought 500 shares at ₹184 without checking anything. No research. No analysis. Just blind faith in a WhatsApp group tip that sounded convincing.
Three months later, the company reported massive losses and mounting debt problems.
The stock crashed to ₹98, and I learned the most expensive lesson.
Fundamental stock analysis became my survival tool after that painful disaster.
Why Fundamental Analysis Matters in India
Fundamental analysis separates real investment opportunities from hyped garbage stocks constantly.
It helps you identify companies that will survive and grow over decades. It protects your capital from pump-and-dump schemes disguised as “multibagger tips.” It gives you confidence to hold through market crashes.
Here’s the brutal truth about Indian stock markets: 90% of stock tips on social media are designed to trap beginners. Most “multibagger” stocks recommended by unknown sources eventually crash to zero. Only companies with strong fundamentals create wealth over decades without destroying capital. Understanding stock market basics is the first step toward making informed investment decisions rather than following blind tips.
I wasted ₹67,000 following tips before I learned fundamentals of stock analysis properly.
After learning fundamental analysis, my success rate improved dramatically. I bought Asian Paints at ₹2,100 after analyzing their consistent profit growth. Today it trades around ₹2,800 with regular dividends.
Fundamental stock market analysis isn’t complicated rocket science reserved for professionals only.
It’s a simple framework anyone can learn in weeks and apply confidently.
What Is Fundamental Analysis?
Fundamental analysis means evaluating a company’s actual business strength before buying its stock.
You examine financial statements to understand profitability and debt levels. You study the business model to see if it makes sense. You analyze management quality to judge if they’re trustworthy.
Think of it like buying a shop.
You wouldn’t buy a shop just because someone said “prices will double.” You’d check monthly revenues, rent expenses, profit margins, customer footfall, and competition first.
Fundamental stock analysis applies the same logical thinking to stocks. For those looking to develop a comprehensive fundamental analysis approach, understanding these core principles is essential for building a systematic evaluation framework.
Here’s what you’re actually evaluating: Does the company make consistent profits or keep losing money year after year? Is the business growing or declining compared to previous five years? Can the company pay its debts comfortably without facing bankruptcy risk soon?
I analyzed HDFC Bank before investing. They showed 18% profit growth annually for five years. Debt was manageable. Business model was simple. I invested ₹80,000 in 2019.
That decision was based on data, not hope or random tips.
Financial analysis removes emotions and replaces them with facts and numbers you can verify.
Key Financial Statements You Must Understand
Three financial statements reveal everything about a company’s real health and performance.
Balance Sheet shows what the company owns and owes on a specific date. Assets on one side. Liabilities on the other side. The difference is shareholder equity.
I check if assets are growing over time. I look at debt levels compared to equity. High debt relative to equity is a red flag.
Profit and Loss Statement shows revenue and expenses over a period like a quarter. Revenue minus all expenses equals net profit. This tells you if the company actually makes money.
I look for consistent profit growth over five years minimum. One-time profits from asset sales don’t count. I need repeatable business profits.
Cash Flow Statement shows actual cash moving in and out of the business. A company can show accounting profit but have no cash. This statement reveals the truth.
I learned this with a manufacturing company. They showed ₹50 crores profit but negative operating cash flow. They were selling on credit with no collections. Stock crashed 60% within six months.
Financial statement analysis saved me from similar traps multiple times since then.
Here’s what I check in each statement: Balance Sheet: Debt-to-equity ratio under 1, growing assets, positive shareholder equity consistently. P&L Statement: Revenue and profit growing 10–15% annually for five years. Cash Flow: Positive operating cash flow matching reported profits closely.
Financial report analysis AI tools now scan these statements in seconds automatically. They flag inconsistencies human eyes miss in complex reports. I use AI stock screener platforms that analyze thousands of financial statements simultaneously. If you’re looking for reliable tools, check out these top stock analysis platforms that can streamline your research process significantly.
I use AI stock screener platforms that analyze thousands of financial statements simultaneously. The Dhanarthi Stock Screener helped me find fundamentally strong stocks in minutes instead of hours.
Reading financial statements felt overwhelming initially. But after analyzing twenty companies, patterns became obvious. Now I can evaluate any company in fifteen minutes.
Important Ratios to Analyze a Stock
Financial ratios simplify complex statements into comparable numbers you can understand quickly.
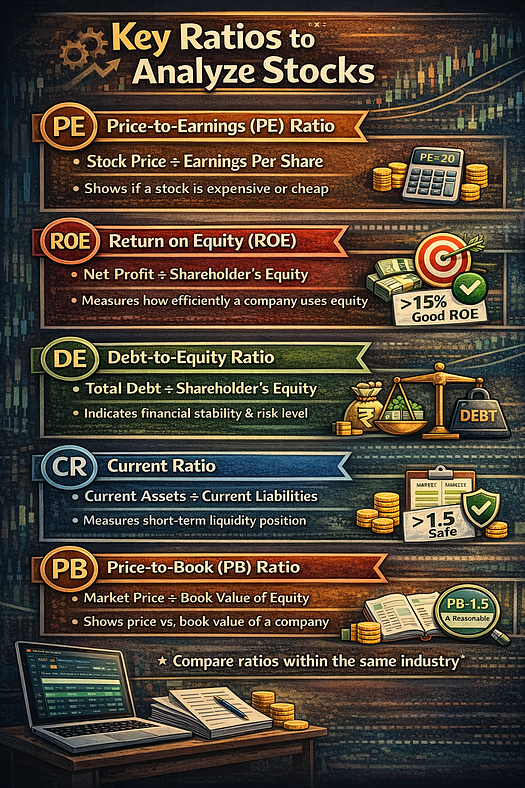
Price-to-Earnings (PE) Ratio shows if a stock is expensive or cheap. Divide stock price by earnings per share. A PE of 20 means you pay ₹20 for every ₹1 of annual profit.
Lower PE suggests cheaper stock relative to earnings. But context matters always.
IT companies trade at PE 25–30. Banks trade at PE 15–20. Compare companies within same sector, not across different industries randomly.
Return on Equity (ROE) measures how efficiently the company uses shareholder money. ROE above 15% is considered good in India. Above 20% is excellent.
I bought a stock with 28% ROE. They were converting every ₹100 of shareholder money into ₹28 of profit annually. That efficiency compounded beautifully over years.
Debt-to-Equity Ratio shows financial stability and risk. Divide total debt by shareholder equity. Ratio below 1 means debt is manageable. Above 2 means high financial risk.
I avoided a steel company with debt-to-equity of 3.2. They were drowning in debt. When recession hit, they couldn’t survive. Stock crashed 75%.
Current Ratio measures ability to pay short-term obligations. Divide current assets by current liabilities. Ratio above 1.5 is comfortable. Below 1 is risky.
Price-to-Book (PB) Ratio shows market price relative to book value. Useful for asset-heavy companies like banks. PB below 2 is generally reasonable.
Here’s my ratio checklist before buying: PE ratio reasonable compared to industry average and company’s historical PE. ROE consistently above 15% for past five years minimum. Debt-to-equity below 1 for most sectors, below 2 for capital-intensive industries. Current ratio above 1.5 indicating comfortable liquidity position.
Stock screener tools filter thousands of stocks based on these ratios instantly. Best stock screener platforms let you set custom ratio filters matching your criteria. For investors serious about mastering ratio analysis, understanding how to interpret and combine multiple ratios creates a powerful framework for stock evaluation.
I filtered for ROE above 20%, debt-to-equity below 0.5, and PE below 25. The screener showed twelve companies. I researched five and invested in three.
All three delivered over 35% returns in eighteen months because fundamentals were strong.
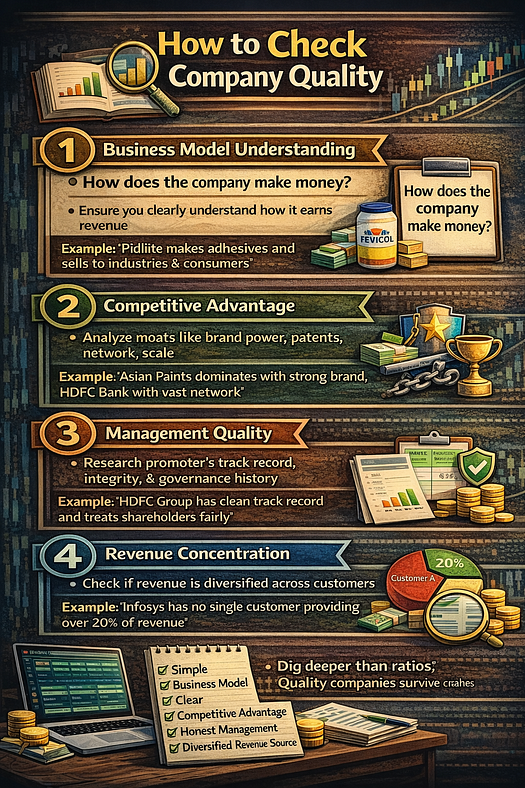
How to Check Company Quality
Numbers alone don’t reveal everything about a company’s long-term survival prospects.
You need to understand the actual business and judge management quality carefully.
Business Model Understanding: Can you explain how the company makes money in two sentences? If not, don’t invest. I avoided crypto and complex fintech businesses because I couldn’t understand their revenue sources.
I invested in Pidilite because their business is simple. They make adhesives and sell to consumers and industries. Revenue is recurring. Margins are stable.
Competitive Advantage: What protects this company from competitors stealing their business? Strong brand, patents, network effects, or high switching costs create moats.
Asian Paints has brand advantage. HDFC Bank has distribution network advantage. Maruti has scale advantage.
Management Quality: Check promoter track record and integrity. Have they delivered on past promises? Do they treat minority shareholders fairly? Any fraud or governance issues?
I research promoter backgrounds on BSE website and read past annual reports. If management repeatedly missed guidance or diverted funds, I avoid the stock completely.
Revenue Concentration: Does one customer contribute 50% of revenue? High concentration is risky. If that customer leaves, the company collapses immediately.
Here’s my quality checklist: Simple business model I can explain to my grandmother easily. Clear competitive advantage protecting the business from new competitors constantly. Honest management with clean track record over ten years minimum. Diversified customer base with no single customer above 20% revenue.
Financial report analysis reveals these factors when you read annual reports carefully beyond numbers.
Quality companies survive recessions. Weak companies with good ratios collapse when challenges emerge unexpectedly.
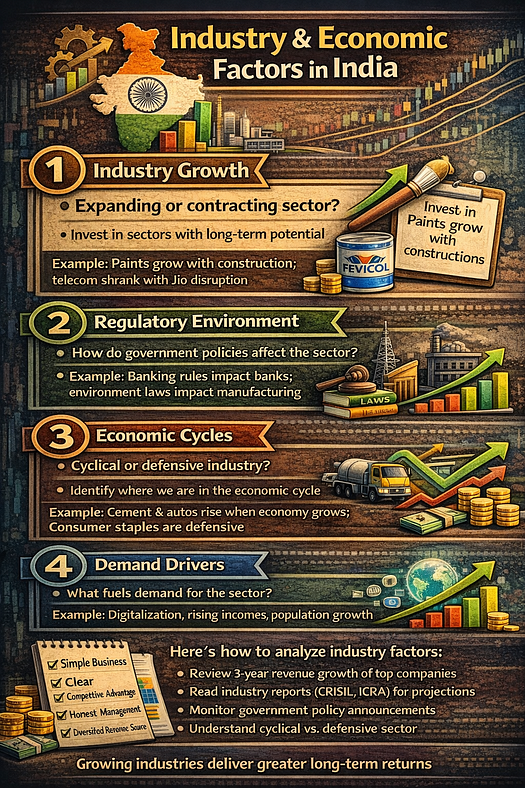
Industry & Economic Factors in India
Individual company analysis isn’t enough without understanding industry trends and economic conditions.
A great company in a dying industry will struggle regardless of fundamentals.
Industry Growth: Is the sector expanding or contracting in India? I invested in paints because real estate was booming. Demand for paints grows with construction activity naturally.
I avoided telecom in 2017 because Jio disrupted the entire sector. Even good companies like Idea suffered because industry economics changed permanently.
Regulatory Environment: Government policies impact certain sectors dramatically. Banking regulations affect banks. Environmental rules affect manufacturing. Pharma depends on drug approval policies.
Economic Cycles: Some industries are cyclical. Cement demand rises during economic growth. Auto sales increase when consumer confidence improves. Understand where we are in the cycle.
I bought cement stocks in 2020 when economy was weak. Everyone was bearish. But I knew demand would recover with infrastructure spending. Those stocks doubled in eighteen months.
Demand Drivers: What’s driving demand for this industry’s products? Population growth? Digitalization? Rising income levels? Government spending?
Here’s how I analyze industry factors: Check three-year revenue growth for top five companies in the sector. Read industry reports from CRISIL or ICRA for growth projections. Monitor government policy announcements affecting the sector directly. Understand if the industry is cyclical or defensive in nature.
A fundamentally strong company in a growing industry delivers maximum returns over decades.
A weak company in a declining industry destroys wealth regardless of current valuations.
How to Compare Stocks Before Investing
You’ll find multiple fundamentally strong stocks, but capital is limited always.
Comparison helps you prioritize which stocks deserve your money first.
I created a simple scoring system for comparing stocks efficiently.
Here’s my comparison framework: Assign 0–10 points for profit growth consistency over five years. Assign 0–10 points for ROE and profitability metrics against sector average. Assign 0–10 points for debt levels and financial stability measures. Assign 0–10 points for management quality and corporate governance track record. Assign 0–10 points for competitive advantage strength and business moat width.
Total maximum score is 50. I invest only in stocks scoring above 35.
I compared three paint companies in 2019. Asian Paints scored 42. Berger Paints scored 38. Kansai Nerolac scored 31. I invested in Asian Paints first.
Here’s another comparison approach: Create a spreadsheet with company names in rows. Add columns for PE ratio, ROE, debt-to-equity, profit growth, and dividend yield. Color code green for good, yellow for acceptable, red for concerning. Choose stocks with most green cells and highest total score.
Best stock screener tools let you compare multiple stocks side-by-side automatically. I compare valuation, profitability, efficiency, and growth metrics across ten stocks simultaneously.
AI stock screener technology ranks stocks based on your weighted preferences. I set 40% weight on profitability, 30% on growth, 20% on valuation, and 10% on financial stability.
The screener automatically ranks stocks matching my priorities instantly. This saves hours of manual comparison work every month.
The Dhanarthi Stock Screener comparison feature helped me choose between similar quality companies objectively instead of emotionally.
Comparison prevents you from investing in the loudest stock instead of the best stock.
Common Fundamental Analysis Mistakes
Beginners make predictable mistakes that undermine their fundamental analysis efforts completely. Beyond fundamental analysis errors, following essential rules to avoid losses helps create a disciplined approach that protects your capital across all investment decisions.
Mistake one: Analyzing only recent one-year data instead of five-year trends. I invested in a company showing 40% profit growth in 2019. Looked amazing.
Then I checked five-year data. They posted losses in three of those five years. That one profitable year was an exception, not the norm. Stock crashed 55% in 2020.
Always analyze minimum five years of data for reliable patterns.
Mistake two: Ignoring cash flow and focusing only on accounting profits. Profits can be manipulated easily. Cash flow is harder to fake consistently.
Mistake three: Not comparing with competitors and industry averages properly. A 15% ROE looks good until you discover competitors deliver 25% ROE consistently.
Context matters more than absolute numbers in fundamental analysis.
Mistake four: Trusting management guidance without verifying past delivery record. Many managements promise 25% growth and deliver 8%. Check if they keep promises historically.
Mistake five: Overlooking red flags like frequent related-party transactions, declining gross margins, or increasing receivables days. These warn of underlying problems before disasters happen.
I missed these red flags in a logistics company. Related-party transactions were 35% of revenue. Management was siphoning money. Stock crashed 70% when truth emerged.
Mistake six: Not using financial statement analysis tools to verify data accuracy. Manual calculations have errors. Automated tools catch inconsistencies and recalculate everything accurately.
Mistake seven: Investing based purely on low PE ratio without checking why it’s low. Stocks are cheap for a reason usually. Sometimes they’re value traps, not value opportunities.
Financial analysis without context and comparison leads to poor investment decisions repeatedly.
Learn from these mistakes before they cost you tens of thousands in real money.
Conclusion: Focus on Quality, Not Tips
Fundamental analysis isn’t about finding “next multibagger” or timing perfect entries precisely.
It’s about identifying quality businesses worth owning for decades regardless of price fluctuations.
What fundamental analysis will help you achieve: Build a portfolio of fundamentally strong companies that survive recessions and thrive decades. Sleep peacefully knowing your investments are backed by real businesses and profits. Avoid catastrophic losses from fraudulent companies or pump-and-dump schemes destroying capital.
Here are your action steps starting today: Choose one company you’re interested in and download their last five annual reports. Read the balance sheet, profit and loss statement, and cash flow statement carefully. Calculate PE ratio, ROE, debt-to-equity, and current ratio using available data. Compare these numbers with two competitors in the same industry sector. Make your first analysis-based investment with ₹10,000 and track it for one year. Before you begin investing, ensure you’re choosing the right broker that offers the tools, pricing, and support you need for your investment journey.
The difference between successful investors and failed traders is simple ultimately.
Successful investors own great businesses. Failed traders chase price movements and hot tips. For those building long-term wealth, combining fundamental analysis with a systematic investment approach through SIPs creates a disciplined framework that removes emotion from investing and builds wealth consistently over time.
👉 Which company will you analyze first using fundamental analysis, and what excites you about it?
👉 Follow for more practical fundamental analysis guides that help you pick winning stocks consistently.
Categorii
Citeste mai mult
Bio‑based PET market was valued at USD 5,050 million in 2025 and is projected to reach USD 15,700 million by 2034, exhibiting a remarkable CAGR of 13.4% during the forecast period. Bio‑based PET, a sustainable alternative to conventional polyethylene terephthalate, is produced by integrating bio‑derived monoethylene glycol (MEG) and terephthalic acid (TPA) sourced from sugarcane, corn or...
" According to the latest report published by Data Bridge Market Research, the Sleep Apnea Oral Appliances Market CAGR Value The persuasive Sleep Apnea Oral Appliances Market report explains market analysis based on regional, local as well as global level. It analyses the key factors which leads to market growth as well as restraints of the market growth. With this...
The North America High Content Screening market is witnessing significant growth, supported by strong investments in pharmaceutical research, biotechnology innovation, and advanced laboratory technologies. The region remains a major hub for drug discovery and life sciences research, where organizations increasingly rely on high content screening solutions to accelerate research workflows and...

Новый подход к релизу Брендан Грин, создатель PlayerUnknown's Battlegrounds и популяризатор жанра «королевская битва», ранее с уверенностью заявлял, что игра выйдет из раннего доступа через шесть-семь месяцев. Однако в недавнем интервью порталу PCGamer разработчик признал, что такой оптимизм был поспешным. Грин отметил, что фиксация конкретного месяца может негативно повлиять на...

The Demi-fine Jewelry Market is experiencing dynamic changes in market share, revenue growth, and competitive threats. Established brands maintain dominance through product quality, branding, and loyal consumer bases, while new entrants introduce innovative designs, digital marketing strategies, and affordability. Understanding shifts in market distribution, revenue patterns, and emerging...