


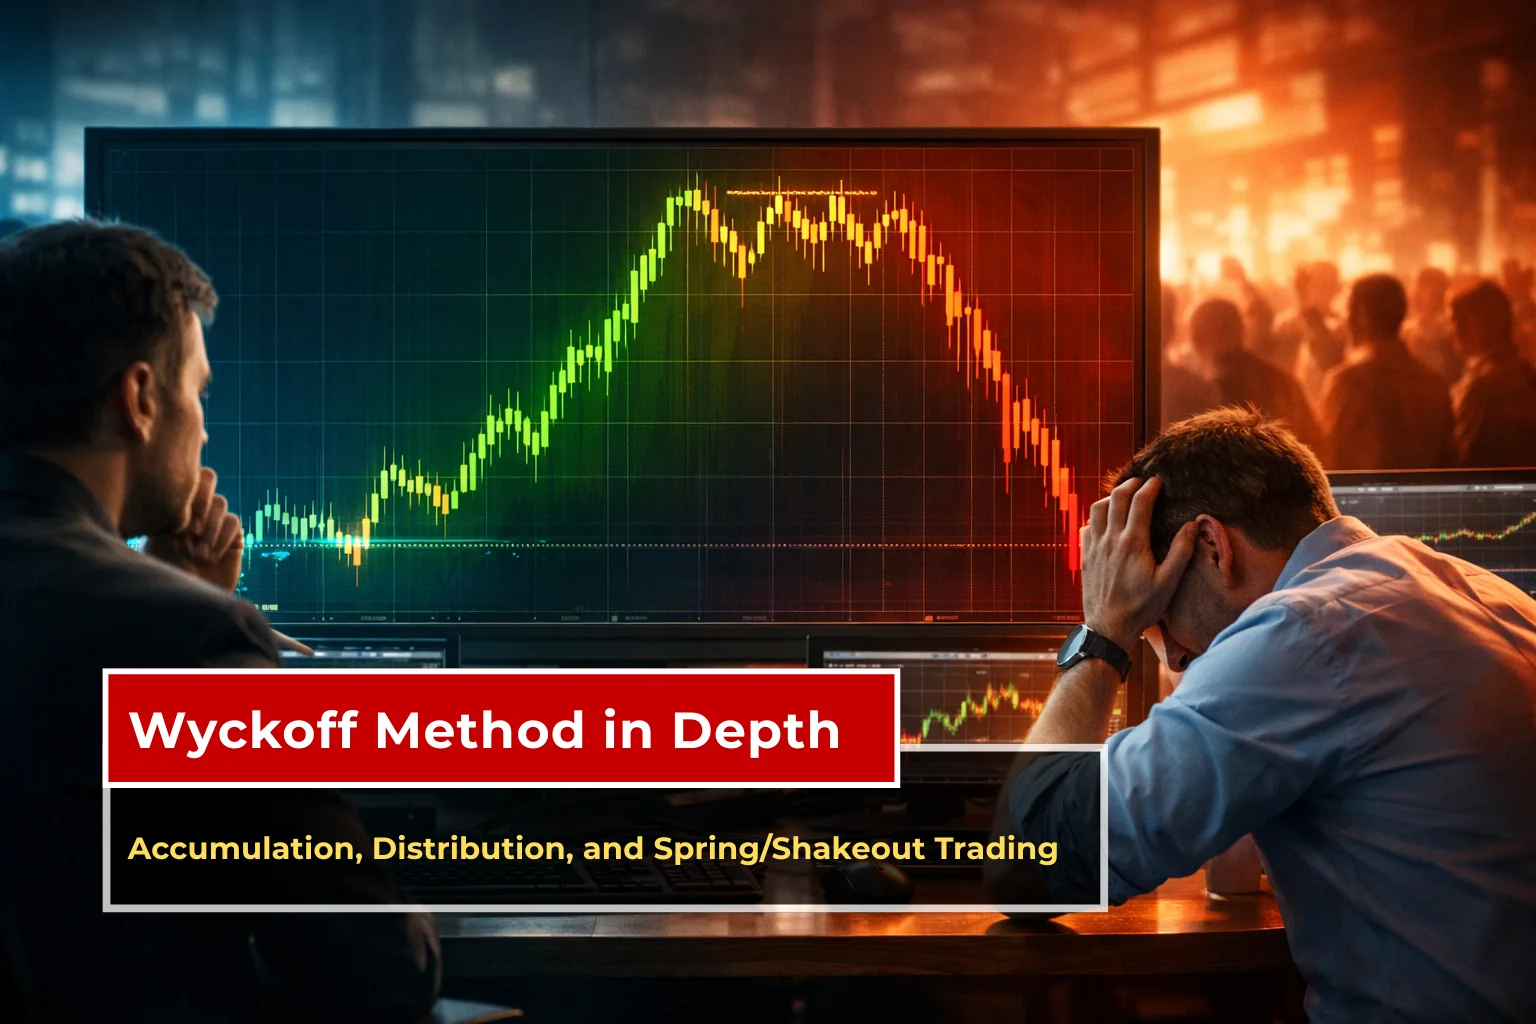
Wyckoff Method in Depth: Accumulation, Distribution, and Spring/Shakeout Trading
This is an excellent breakdown of the Wyckoff Method accumulation distribution phases. You’ve captured the "Composite Man" psychology perfectly—especially the bit about the market being a story told through price and volume.
Since your goal is to help traders visualize these complex phases on real charts, I’ve refined the technical explanations and added some visual cues to help your readers identify these setups more accurately.
Mastering the Wyckoff Market Cycle
To trade like "Smart Money," you must first recognize that the market doesn't move randomly. It moves in a deliberate four-phase cycle designed to transfer shares from "weak hands" (retail) to "strong hands" (institutions).
1. The Accumulation Phase
This is where the "Smart Money" buys. After a long downtrend, the price begins to move sideways. The goal of the institution is to buy a large position without spiking the price.
-
The Spring: This is the most critical event. It is a "false breakdown" below support that hunts for stop-losses, providing the liquidity institutions need to finish their buy orders.
-
The Test: After a Spring, the price usually returns to the breakout level on low volume. This confirms that sellers are finally exhausted.
2. The Distribution Phase
The mirror image of accumulation. After a massive rally, institutions begin to offload their shares to late-coming retail traders who are buying out of "FOMO" (Fear Of Missing Out).
-
The Upthrust (UTAD): Just like the Spring, this is a "false breakout" above resistance. It traps breakout traders before the price collapses.
-
Sign of Weakness (SOW): A sharp drop on high volume that proves supply is now overrunning demand.
Wyckoff Spring Strategy vs. Shakeout
While often used interchangeably, there is a subtle difference in how you trade them:
|
Feature |
Wyckoff Spring |
Terminal Shakeout |
|
Location |
Occurs at the end of an accumulation range. |
Can occur anytime during a trend. |
|
Intensity |
Usually a brief dip below support. |
A violent, rapid crash designed to "shake out" everyone. |
|
Volume |
High volume on the dip, low on the recovery. |
Extreme volume; looks like a total collapse. |
|
Goal |
To test the remaining supply. |
To clear the board of all leveraged positions. |
Key Volume Laws for Indian Markets
In the context of the NSE or MCX, volume is your "truth serum." Richard Wyckoff’s Law of Effort vs. Result is the secret sauce:
-
Effort (Volume) = Result (Price Move): If Nifty has a huge green candle on huge volume, the move is healthy.
-
Divergence: If a stock tries to break a new high but volume is lower than the previous peak, the "effort" is missing. This is a massive warning sign of a coming Distribution top.
Pro-Tip: On TradingView, use the Volume Profile indicator alongside the Wyckoff Method. It shows you the "Point of Control" (POC)—the exact price where the most trading happened within your accumulation range.
Your Step-by-Step Execution Plan
To apply these Wyckoff trading techniques tomorrow morning, follow this checklist:
-
Step 1: Find a stock that has been sideways for at least 3–6 months (The "Cause").
-
Step 2: Identify the Preliminary Support (PS) and Selling Climax (SC).
-
Step 3: Wait for the Spring. Do not buy the breakdown; buy the recovery back into the range.
-
Step 4: Place your stop-loss just below the low of the Spring.
-
Step 5: Exit chunks of your position during the Markup phase as the price reaches previous Distribution zones.
Since you're looking at the Indian market specifically, are you finding these patterns more frequently in large-cap stocks like Reliance, or are you spotting them in the mid-cap sectors lately?
الأقسام
إقرأ المزيد
In today’s busy lifestyle, maintaining your health can feel like a challenge. Sedentary jobs, long hours, and digital distractions often lead to low energy, weight gain, and chronic fatigue. One of the most effective ways to combat these issues is regular Exercise. Exercise is not just about losing weight or building muscles. It supports your heart, lungs, joints, mental health,...
"Detailed Analysis of Executive Summary Medicinal Chemistry for Drug Discovery Market Size and Share CAGR Value The global medicinal chemistry for drug discovery market size was valued at USD 6.94 billion in 2024 and is expected to reach USD 19.25 billion by 2032, at a CAGR of 13.60% during the forecast period The Medicinal Chemistry for Drug Discovery...
Gold jewelry shimmers under bright lights, flowers fill the air, and guests dance to loud, fun music. These weddings are huge and happen over many days. They have many special steps that need a photographer who knows exactly what to look for. Normal photography is often for smaller, simpler days, but these celebrations need an artist who gets the culture, the fast pace, and the deep feelings....
Commercial Utility Transport As per MRFR analysis, the global market for commercial utility transport is experiencing strong growth, driven by increasing industrialization, infrastructure development, and the rising need for efficient logistics solutions. Commercial utility vehicles (CUVs) play a crucial role in transporting goods, equipment, and personnel across diverse sectors such as...
Noodle Making Machine factory plays an important role in supporting OEM orders for businesses around the world. Many companies seek manufacturers who can produce machines under their own brand, and noodle making machine factories are prepared to meet these requests through well-organized processes. cnhaiou noodle making machine factory provides OEM services designed to support clients who need...